![]()
yyc-community-metrics
An aggregation of community-related data for City of Calgary
Data Aggregation
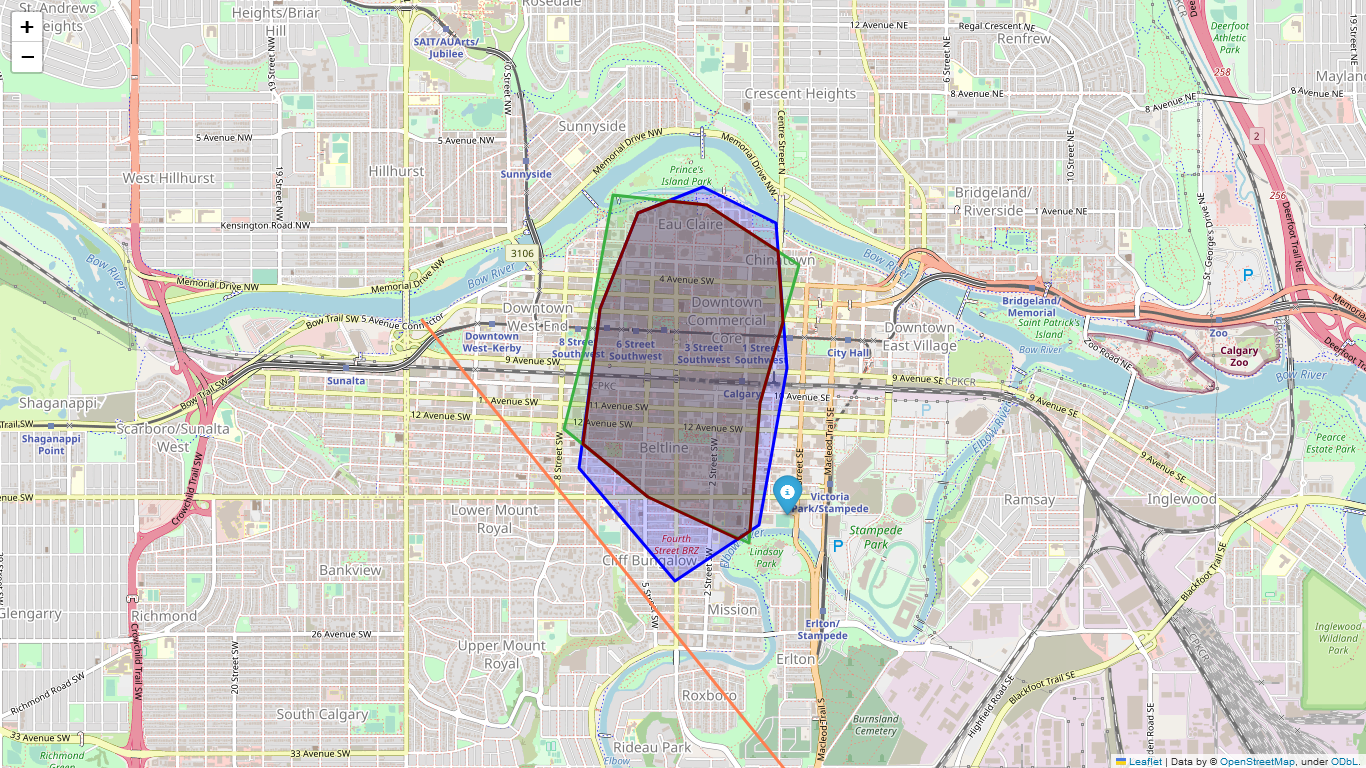
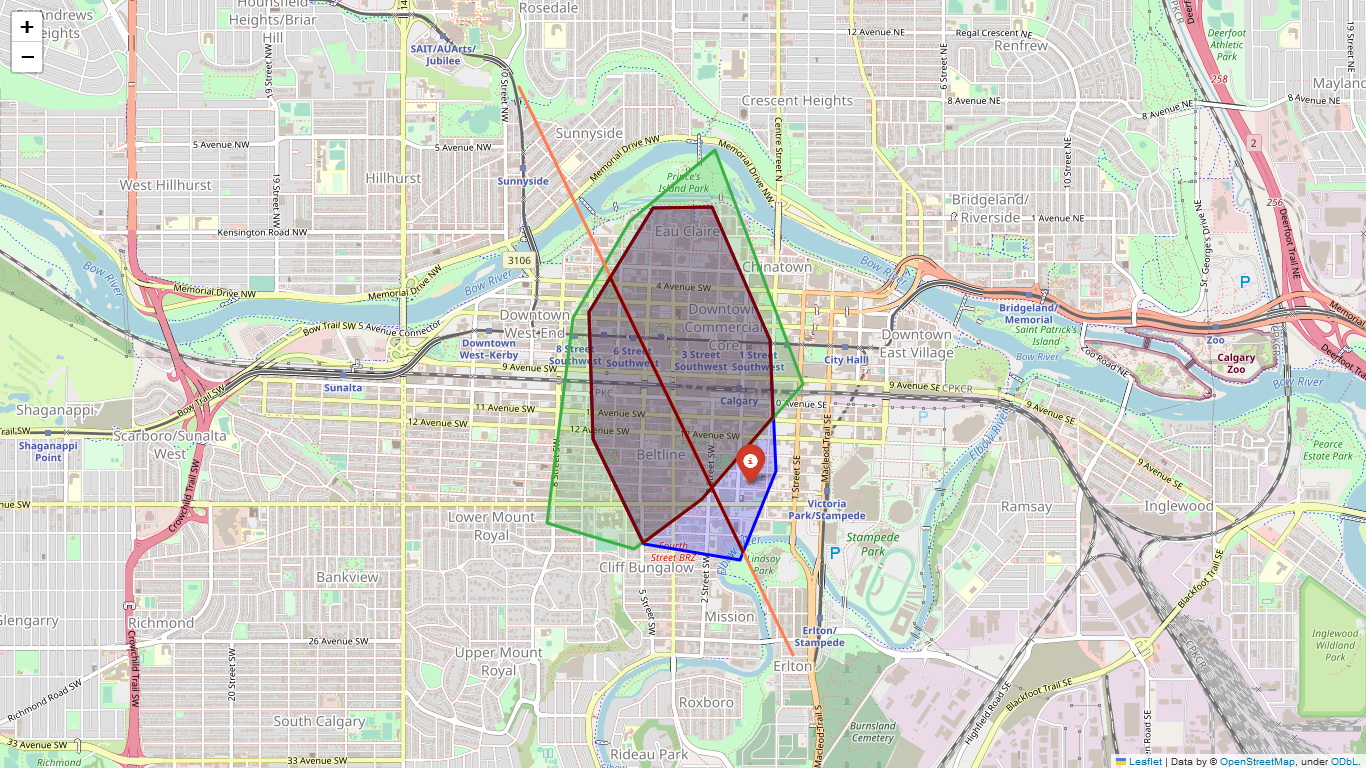
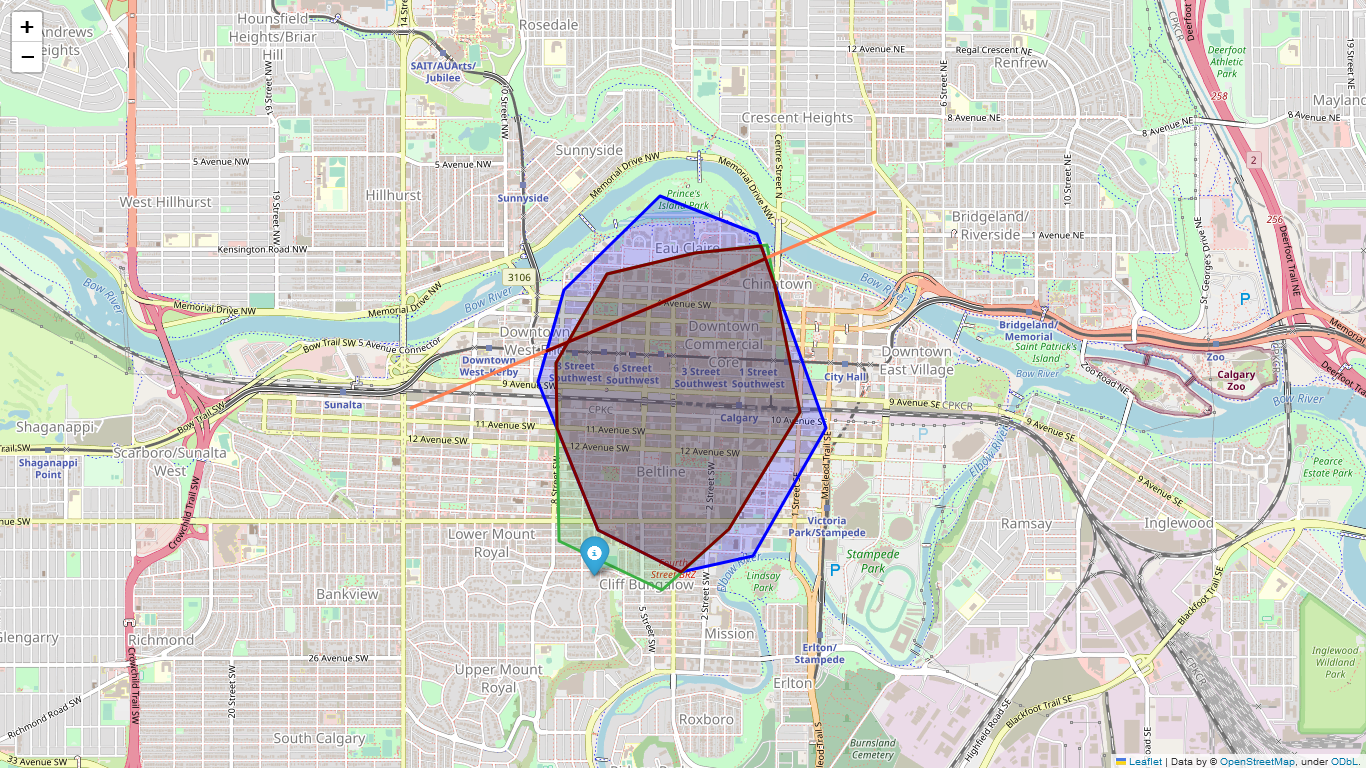
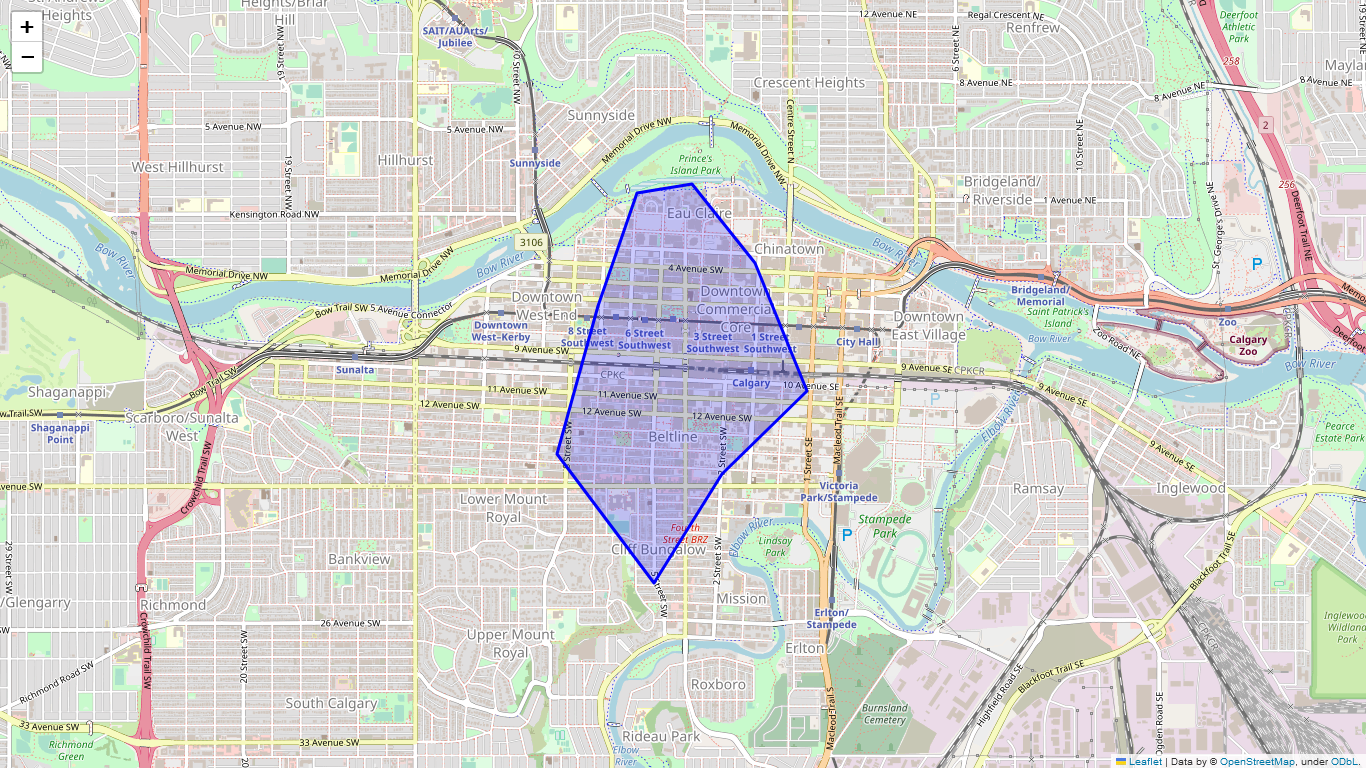
Each community is a polygon in the map. When we aggregate data for a community, only the intersected portion of a feature is considered.
See the following examples where we use a blue polygon to represent a community, a green polygon / a orange line / a point to represent a feature. Only the red portion of those features will be taken into consideration during data aggregation.
Projection
Use UTM projection for area / length calculation.
Outcome
See the and/or files. Also check out a guessing game that is based on the aggregation result.
Last modified on: 2024-02-22 11:37:01