Agile Scrum Note 09
Tools and techniques to monitor Scrum projects
Principles in monitoring Scrum Projects
- Ideally, the TEAM should monitor its own progress
- The manager or Scrum Master should NOT micro- manage
- The Scrum Master should try to provide the team visibility so that they can make informed decisions
- Common tracking mechanisms in Scrum
- Daily stand-up meetings
- Reviews and retrospectives
- Metrics
- Charts
- Information radiators
Metrics
- A metric is a standard for measuring or evaluating something.
- A measure is a quantity, a proportion, or a qualitative comparison of some kind.
- Quantity: "There are 25 open defect reports on the application as of today."
- Proportion: "This week there are 10 percent fewer open defect reports than last week."
- Qualitative comparison: "The new version of the software is easier to use than the old version."
- Types of metrics
- Business
- RTF (Running Tested Features)
- Earned Business Value (EBV)
- Net Present Value (NPV)
- Internal Rate of Return (IRR)
- Return on Investment (ROI)
- Process
- Impediments cleared per iteration
- Impediments & User stories carried over the next iteration
- User stories done per iteration
- Defects carried over the next iteration
- Team member loading
- Velocity
- Backlog size
- Project Testing
- Acceptance tests per story
- Defects count per story
- Escaped Defects per cycle
- Tests time to run
- Tests run per frequency
- Time to fix tests
- Do's and Don'ts
- Measure only a few things that matter (just because it can be measured doesn’t mean it is important)
- It should be easy to calculate (ideally an automated process)
- If it is too cumbersome, either people won’t do it or it will be incorrect
- It should be easy to explain and interpret
- It should result in tangible action
- Behavior that you want to encourage OR
- Behavior that you want to discourage
- Use metrics to guide action, not for witch-hunts
- In Scrum, team metrics are preferred
- Do NOT use metrics for performance appraisals
- It will usually result in perverse incentive to manipulate the number
- Business
Charts in Scrum
- Commonly used charts:
- Burn-down, Burn-up charts
- Cumulative Flow Diagrams
- Progress Charts
- Risk profile graphs
- Others
- Charts are useful because:
- It indicates trends (trends are more important than absolute numbers)
- It is more "visual" (a picture is worth a thousand words)
- Management loves charts!
Burn-down Chart
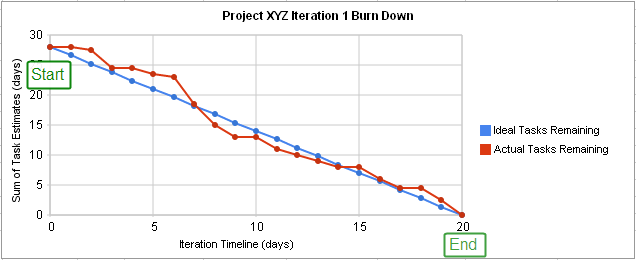
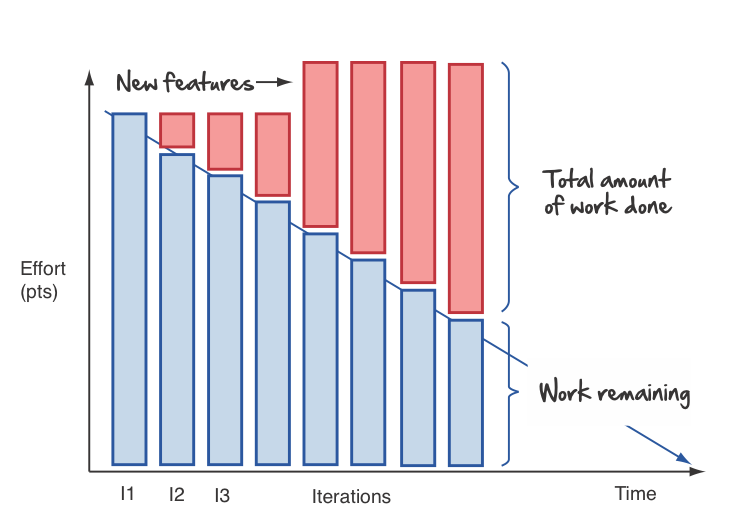
Burn-down Chart Bar Style
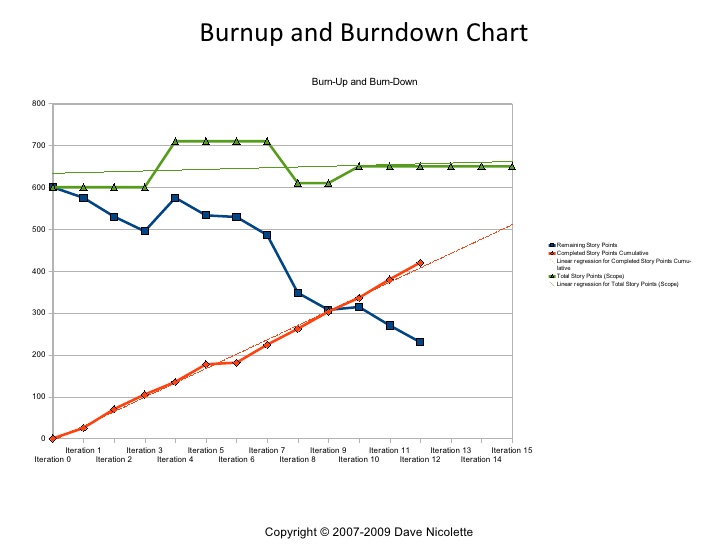
Burn-up and Burn-down Chart
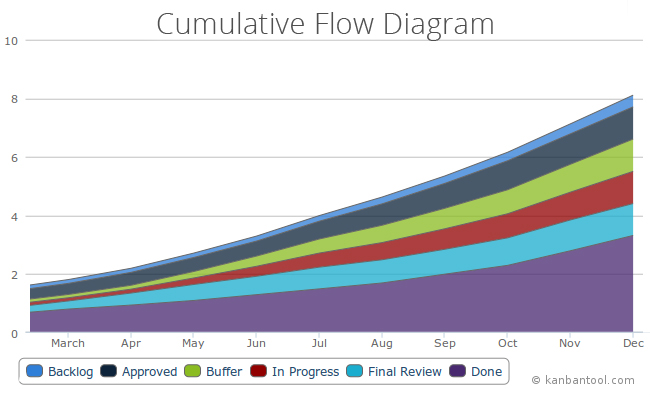
Cumulative Flow Diagram
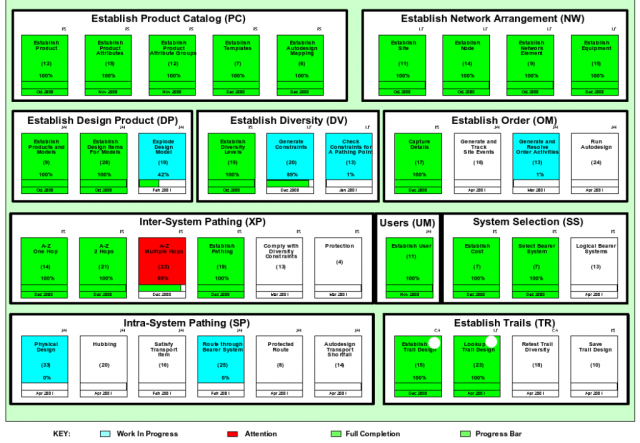
Parking Lot Diagram
Escaped defects found
Escaped Defects Found counts number of new escaped defects found over period of time (day, week, month).
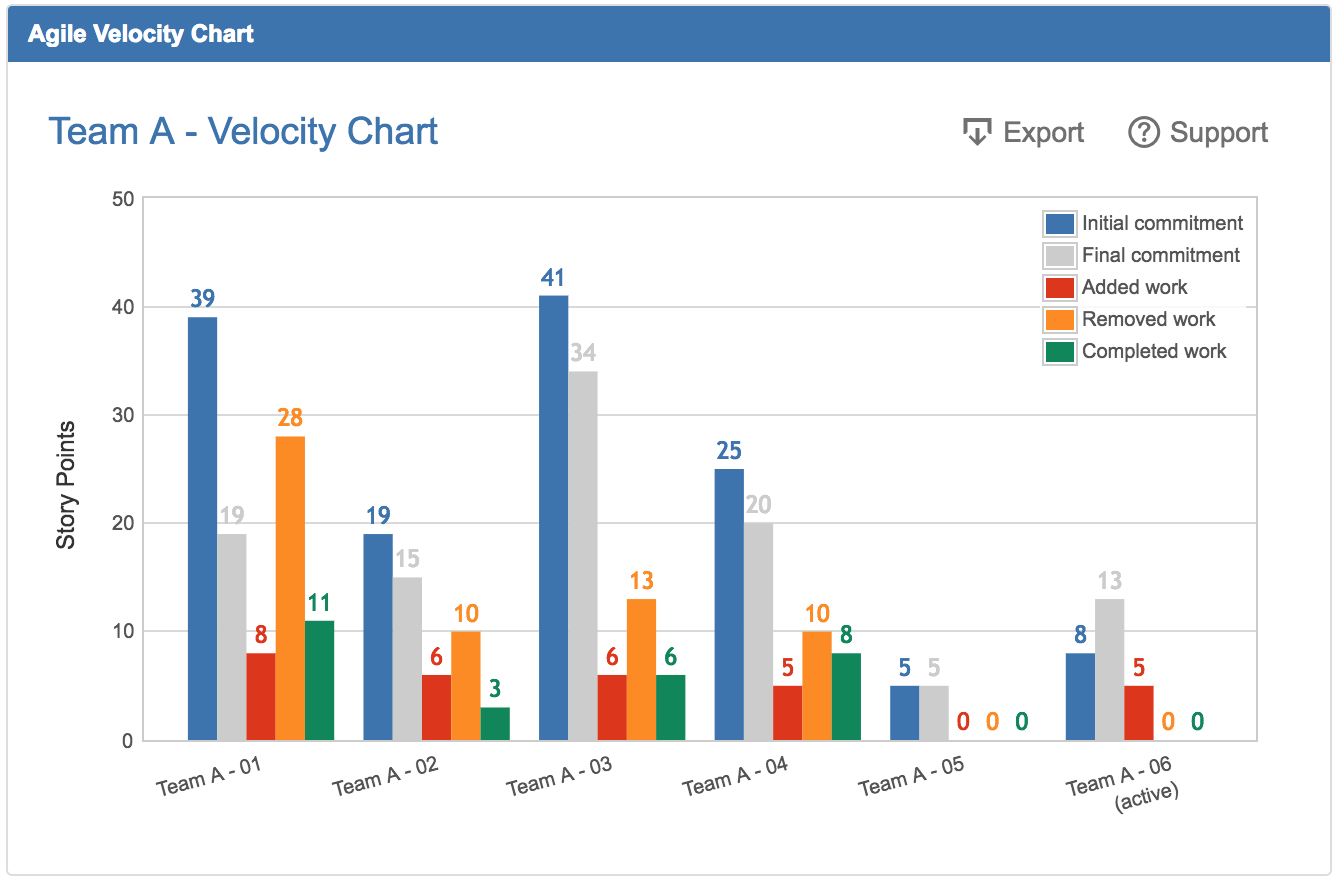
Velocity Chart
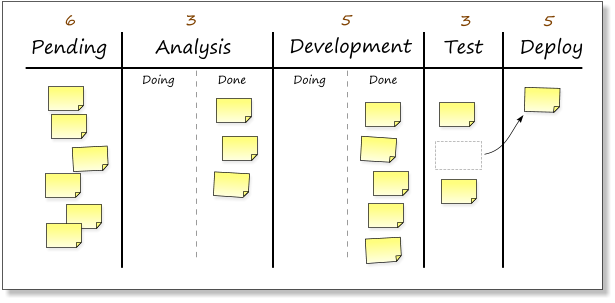
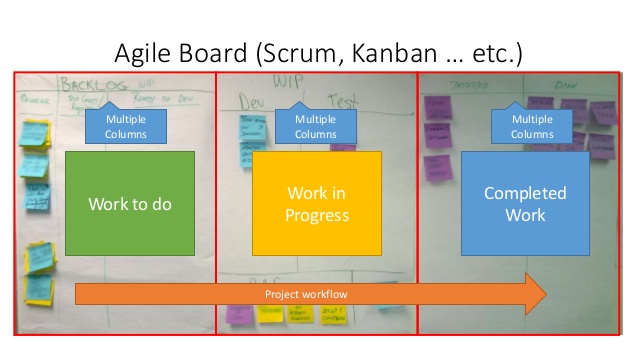
Progress Chart / Kanban
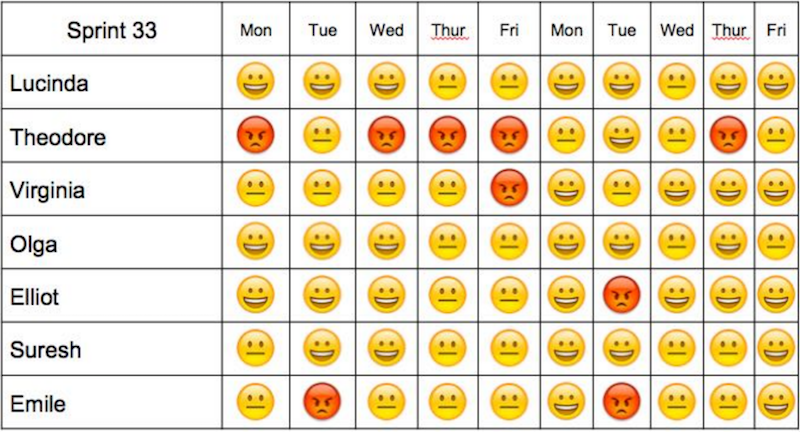
Niko Niko Calendar
Information radiators
"An information radiator displays information in a place where passers by can see it. With information radiators, the passers by don't need to ask any question; the information simply hits them as they pass."
- Invented by Alistair Cockburn
- Team members can view the current state of the project : schedules, tasks, progress, issues
- Scrum teams should use it to make progress (or lack of) visible
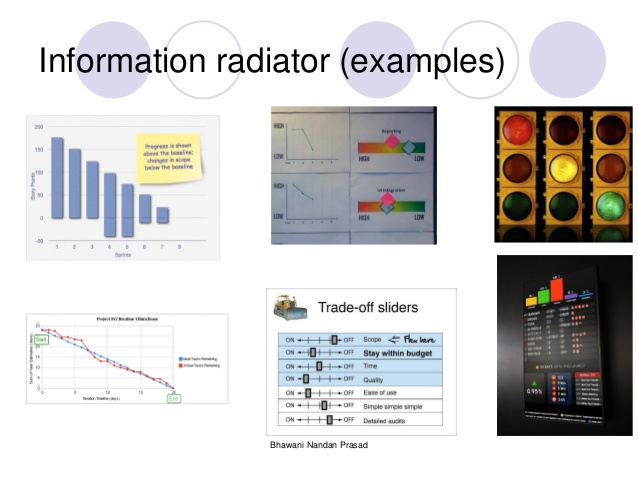
Most popular Information radiators are:
- Task Boards
- Big Visible charts (Includes burn down charts)
- Continuous Integration build health Indicators (Including lava lamps and street lights)
Effective Information Radiators should be :
- Simple: Should be Brief and concise.
- Stark: Should display the progress and expose problems. Errors should not be masked, rather used to improve the work and performance
- Current: Information displayed should be current
- Transient: The problems and errors shouldn't be there on the chart for long; once the problem has been rectified, it should be taken off
- Influential: Influences the team members and management and empowers the whole team to take decisions
- Highly visible
- Minimal in number